A social analysis of...

311 Service Requests in New York City

Final project of the course Social Data Analysis and Visualization.

The Data

In the research phase of our project, our attention was caught by one dataset in particular: 311 Service Request in NYC from 2010 to Present.

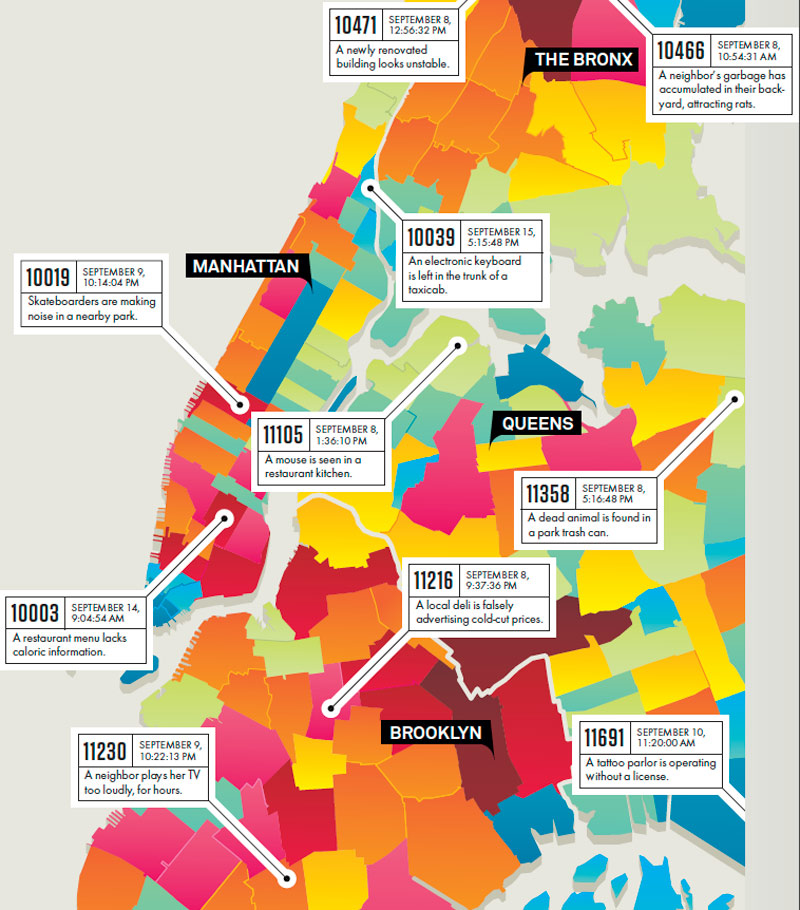
311 is a special telephone number that people can call to access non-emergency government services, a sort of 911 without the life-and-death factor. Clicking the image on the right you can see some examples.

Originally implemented with a call center, it has evolved over the years with technology: you can now submit a request via website or mobile app in a few seconds. You can also follow the status of the request until it is closed.

Exploration

Driven by curiosity, we started our analysis by looking at the most frequent complaints and their respective locations.

There is no better way to see our findings than seeing it by yourself! Just click anywhere in the map of New York City to get started.

Statistics

We spent the first two weeks of the project playing around with the complaints, extracting some interesting statistics while trying to understand on what to focus in the real analysis. We even produced a cool Youtube video explaining them: if you haven't already you should definitely check it out!

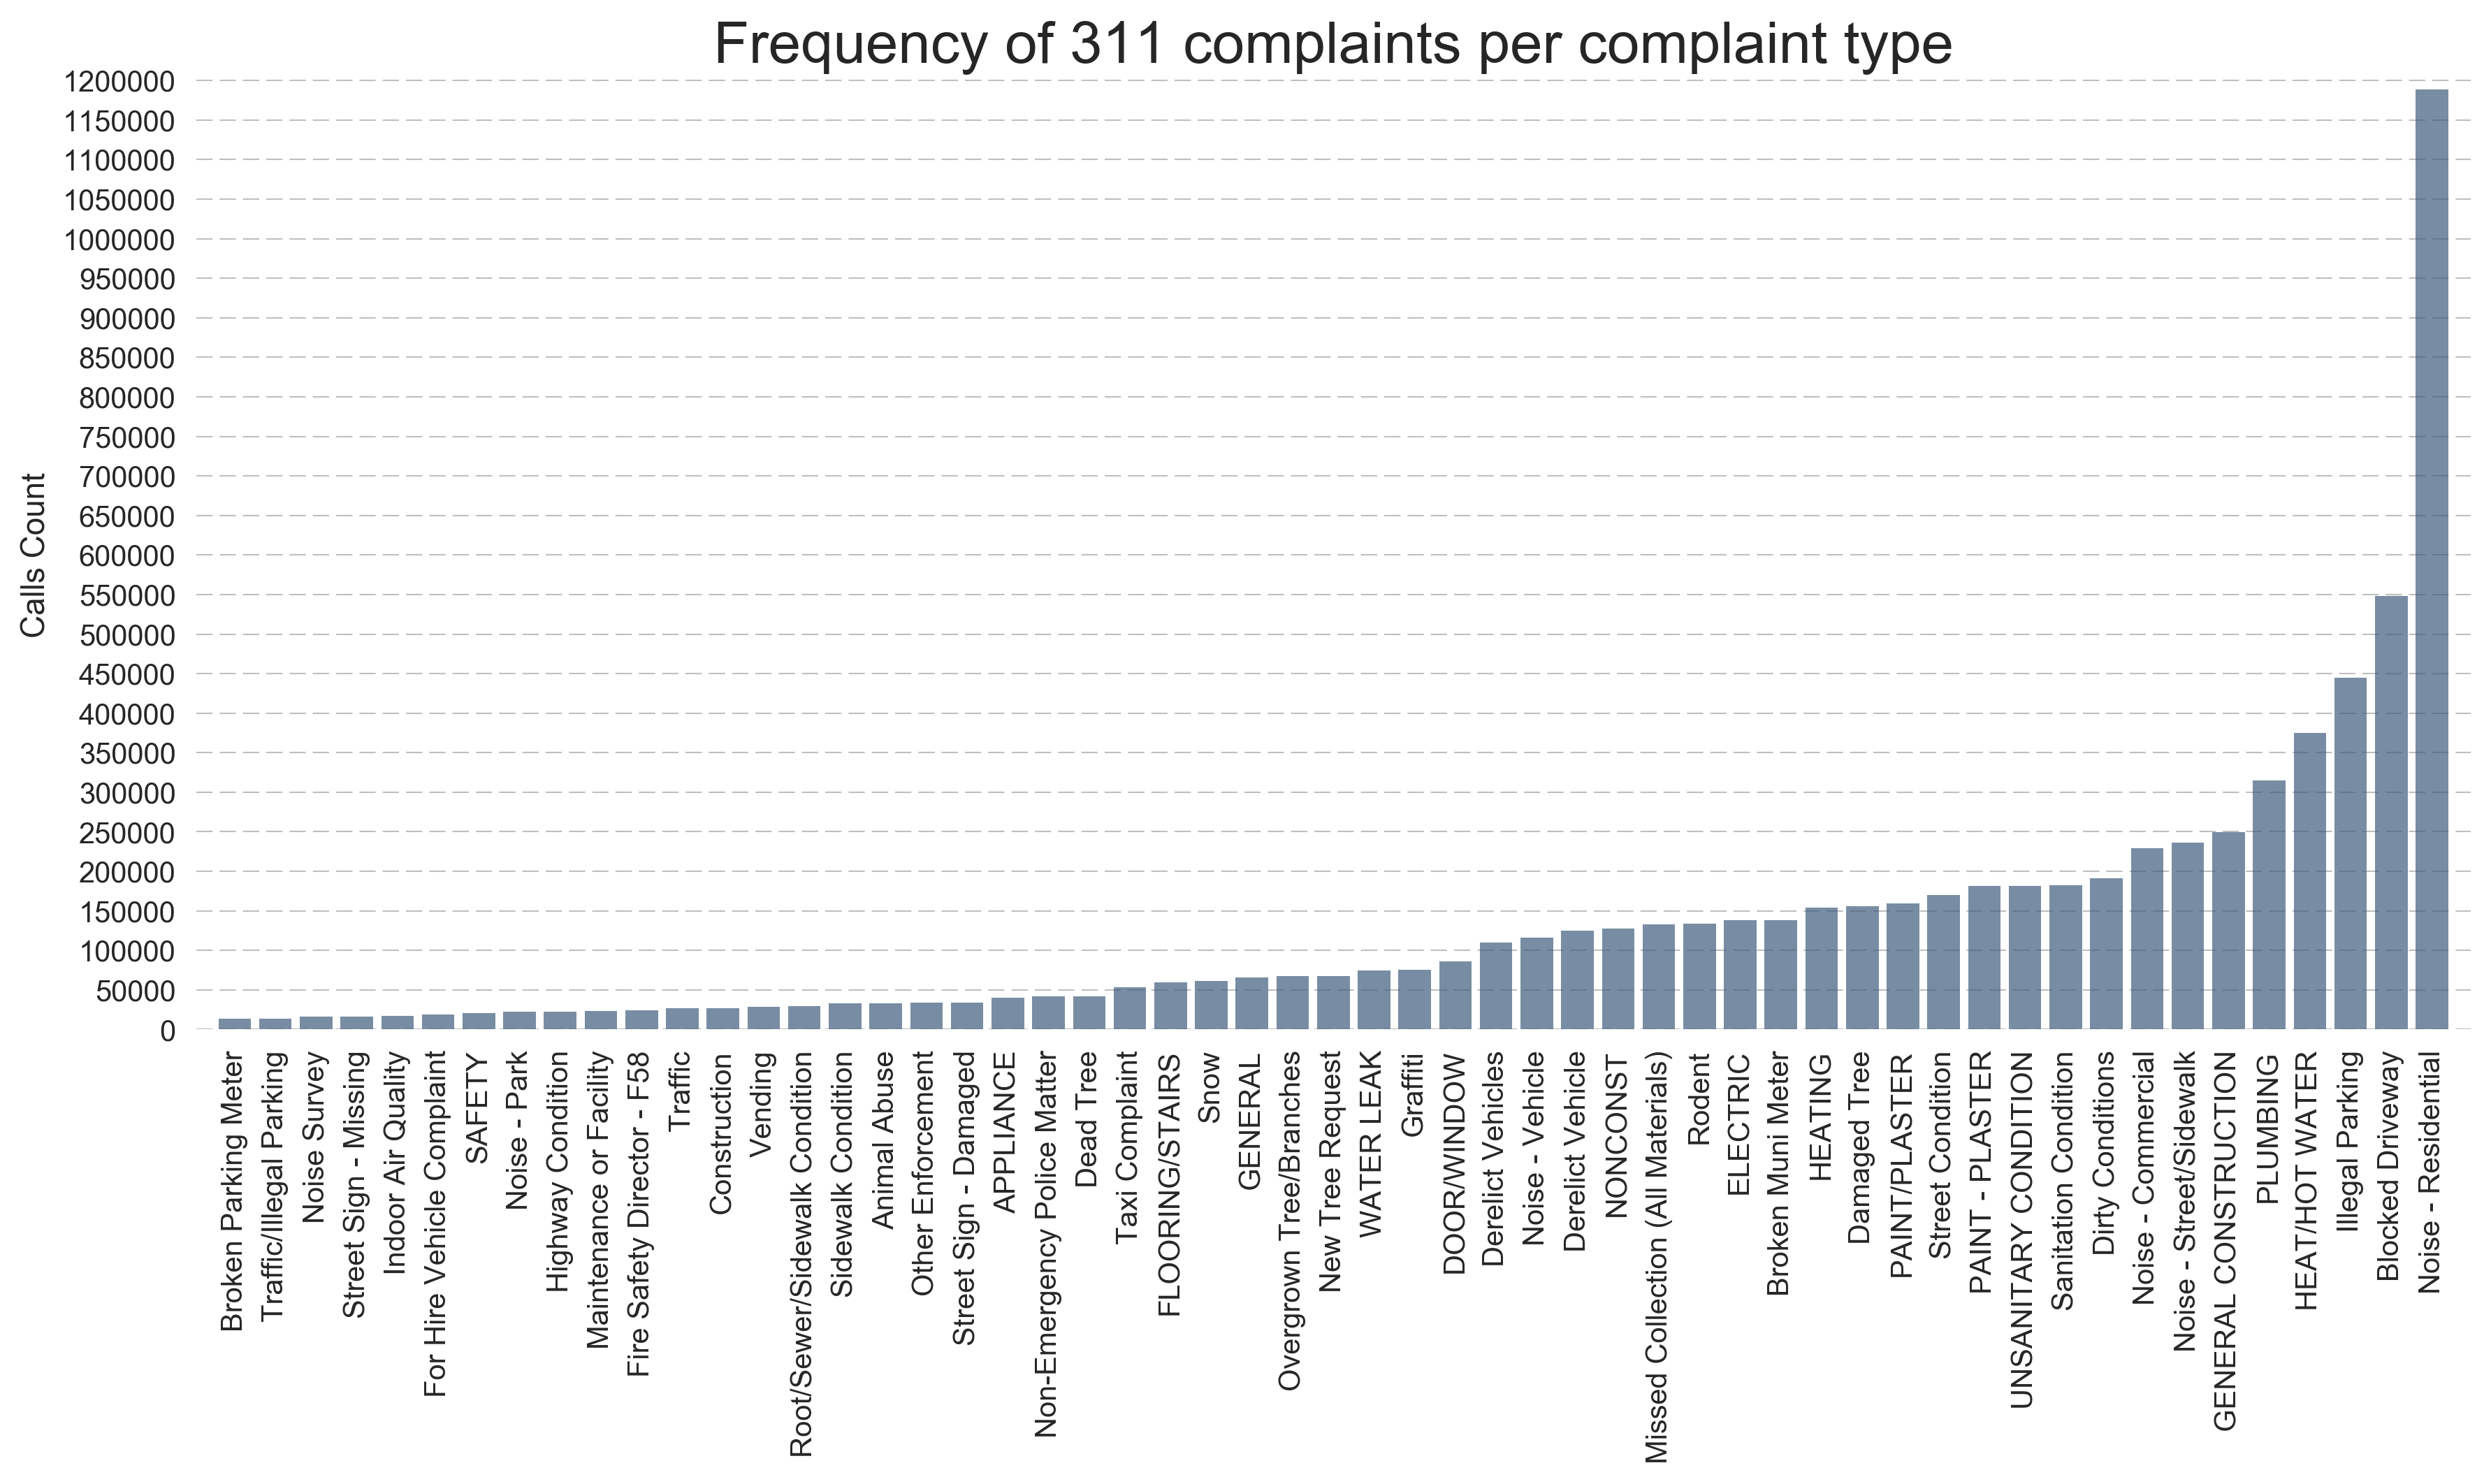
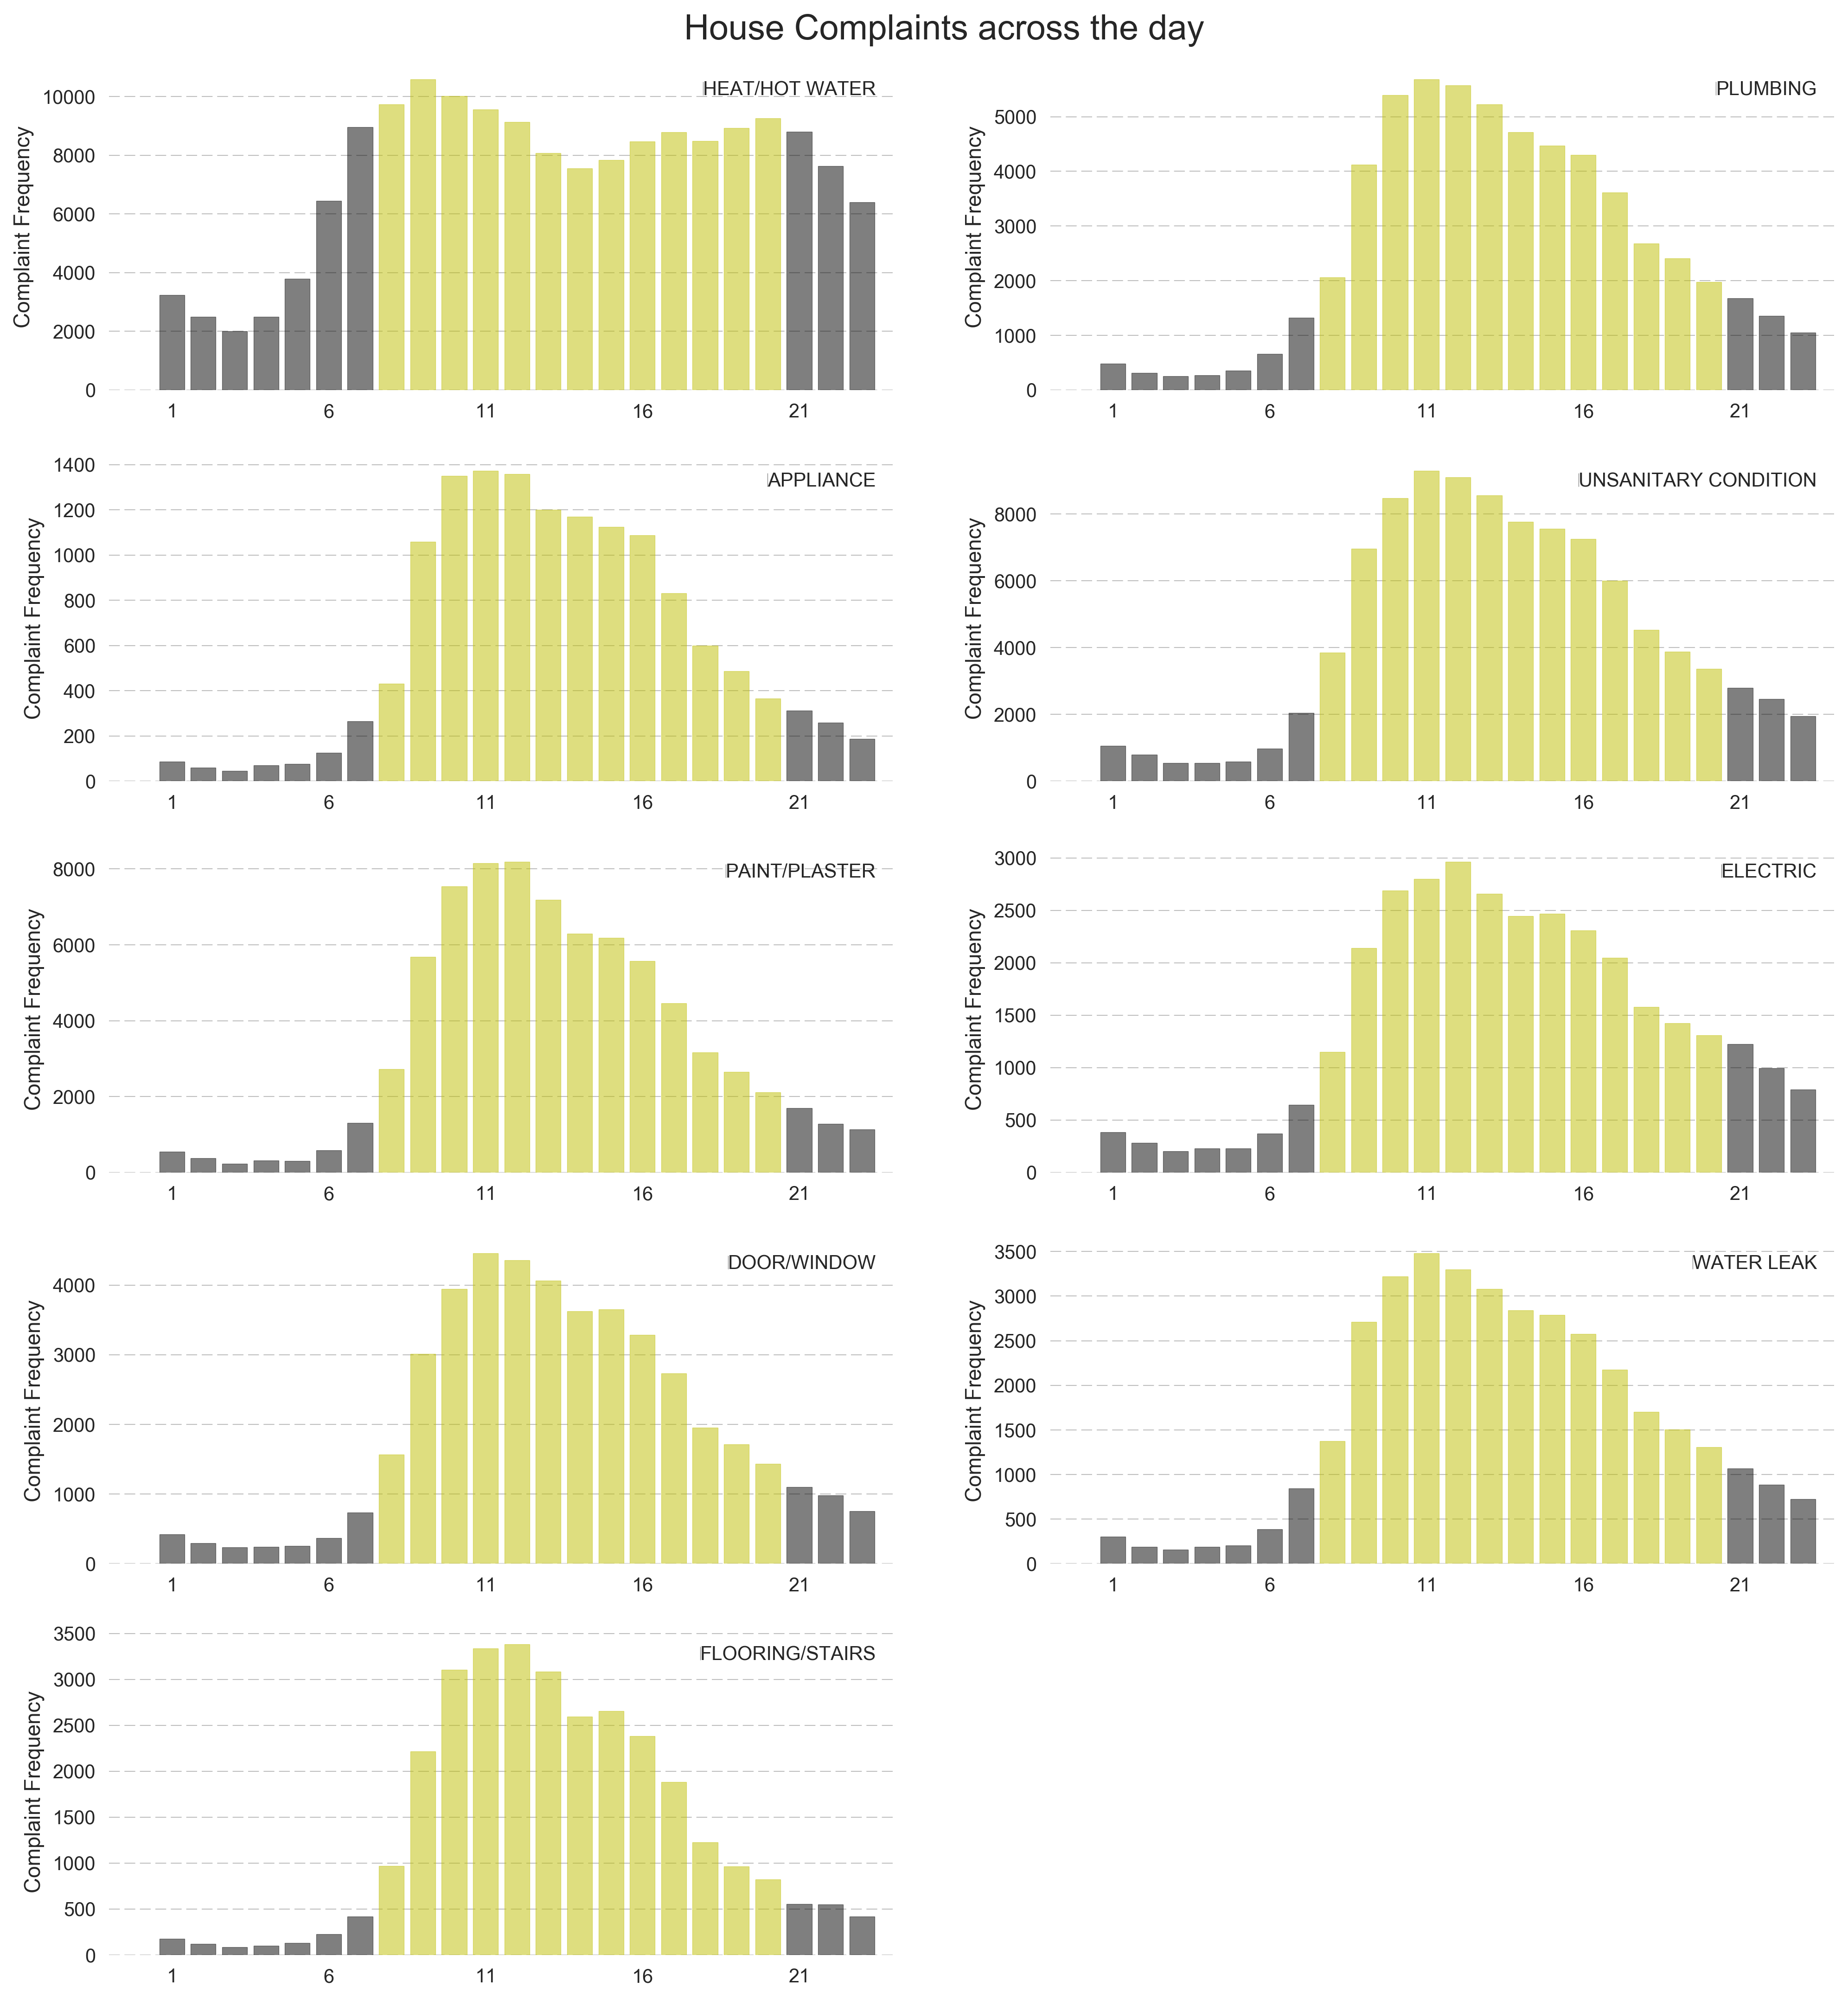
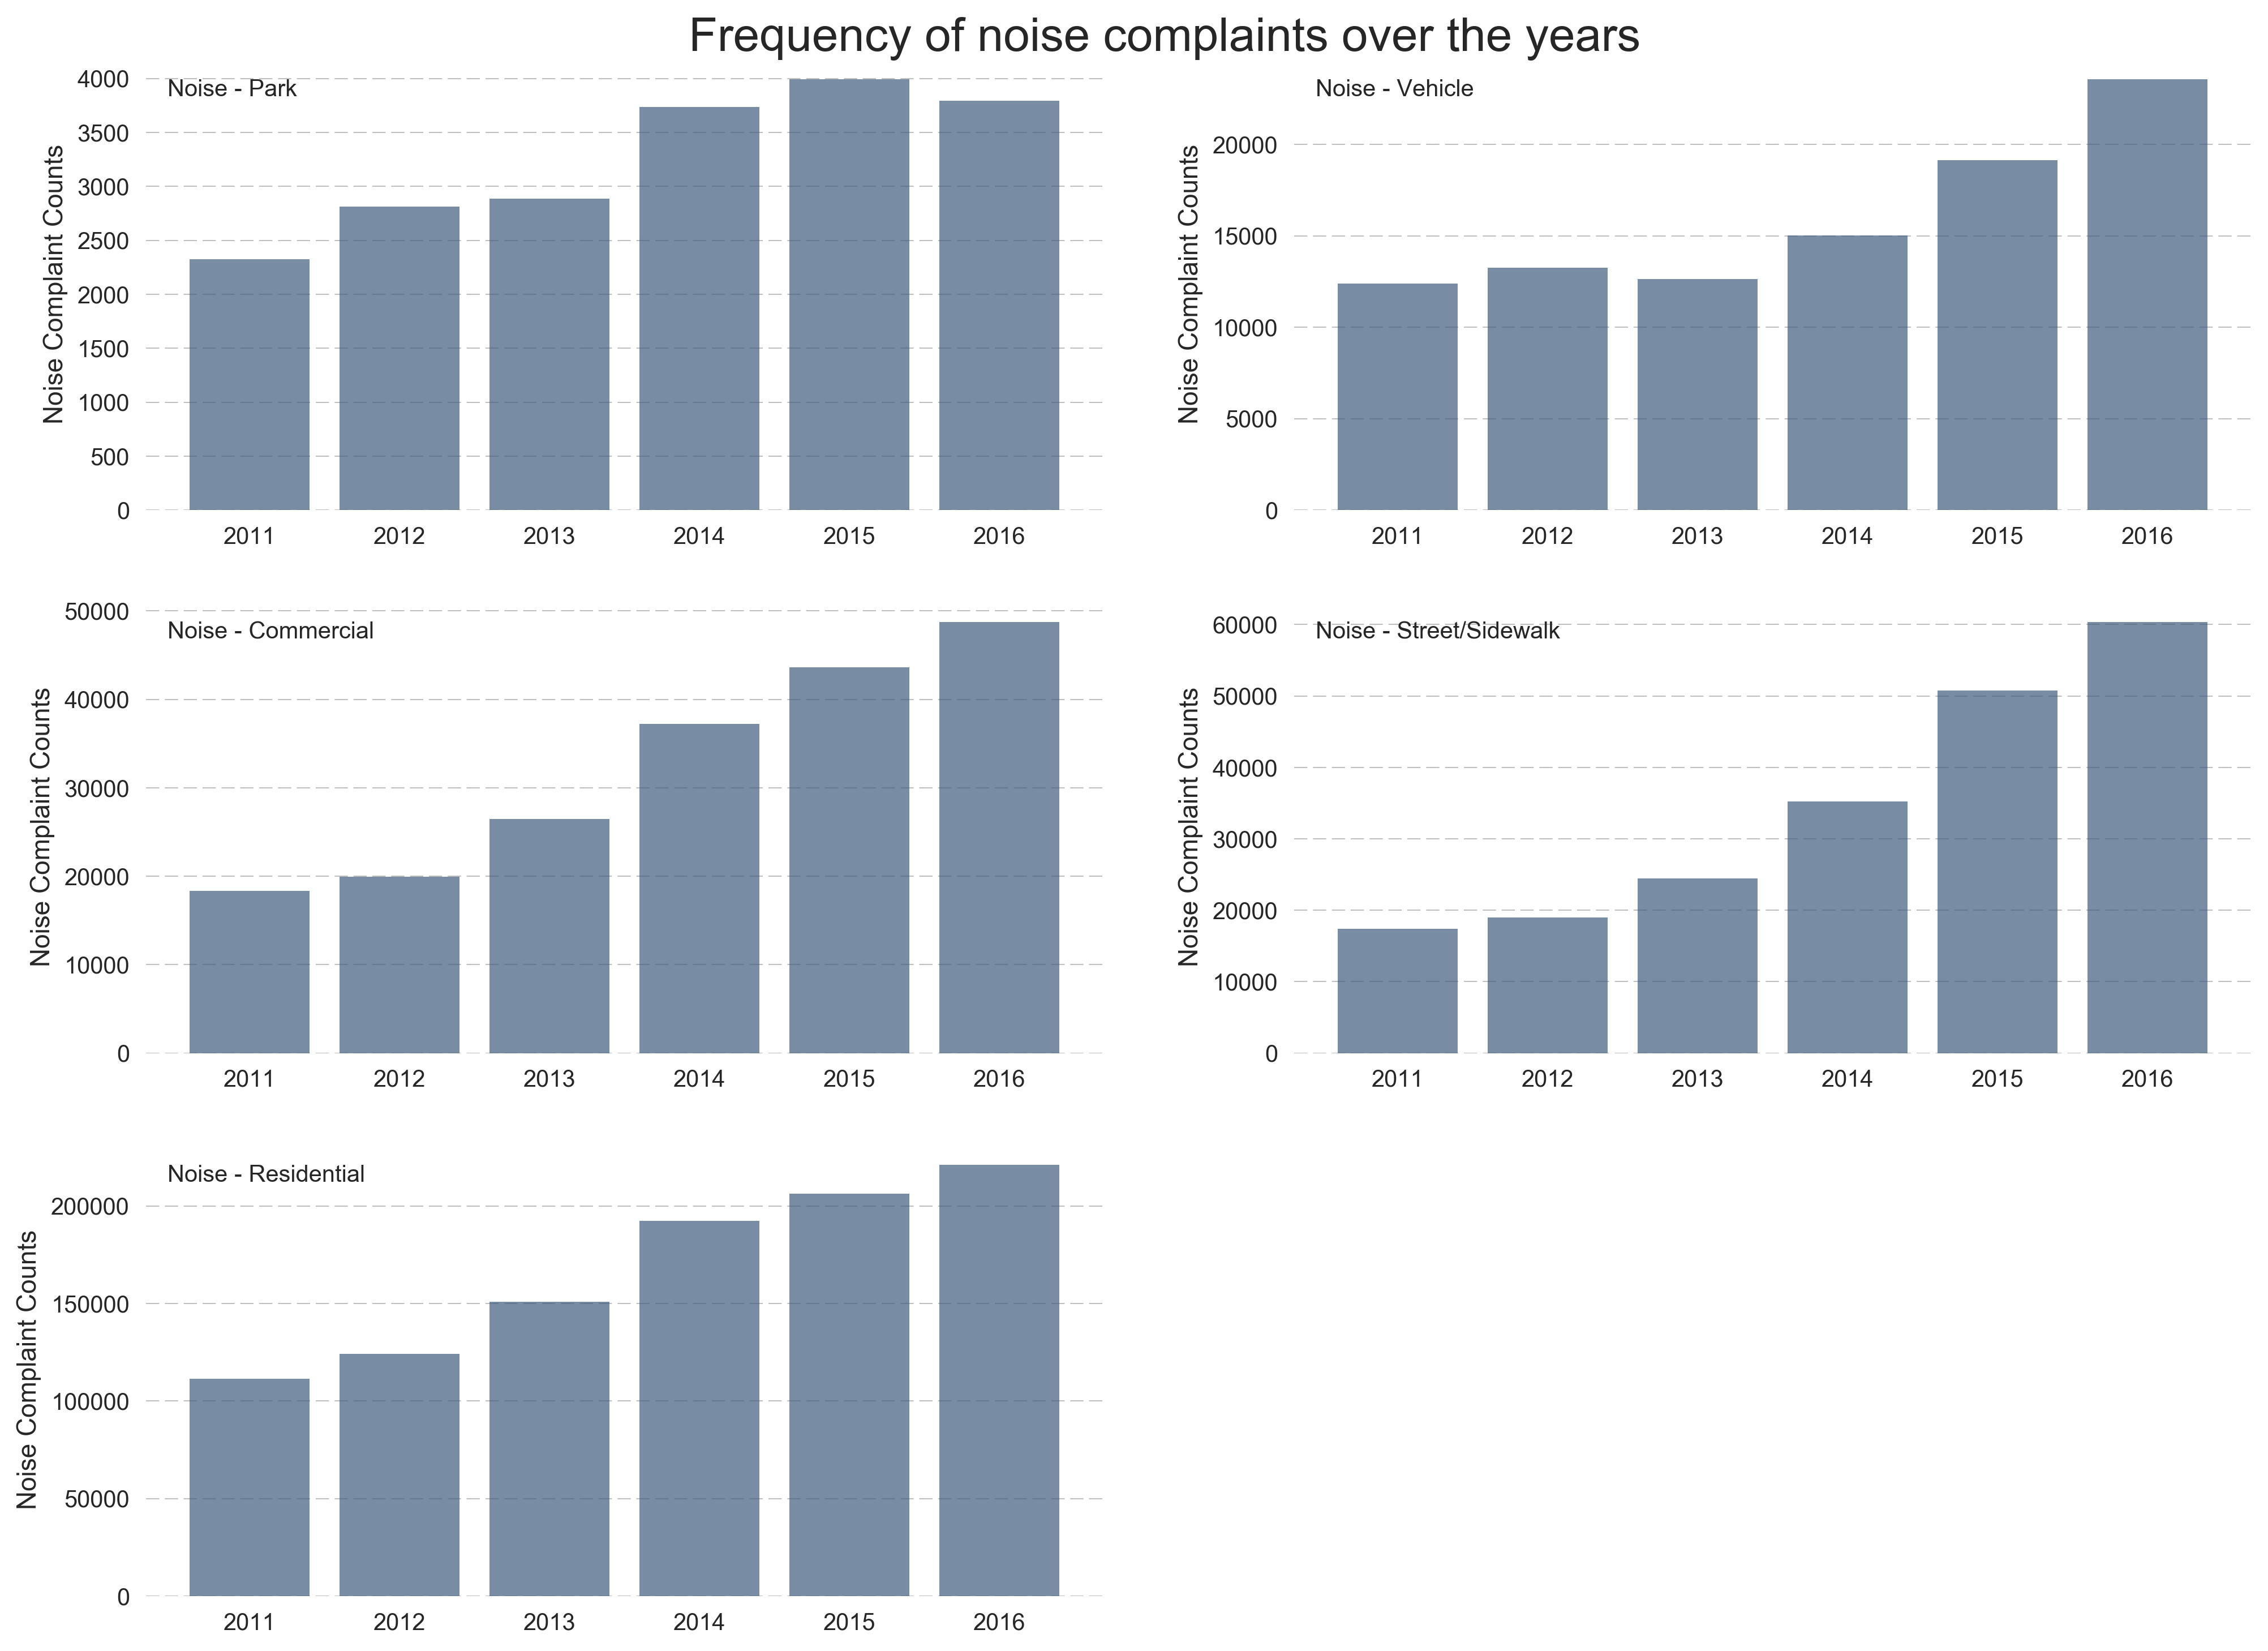
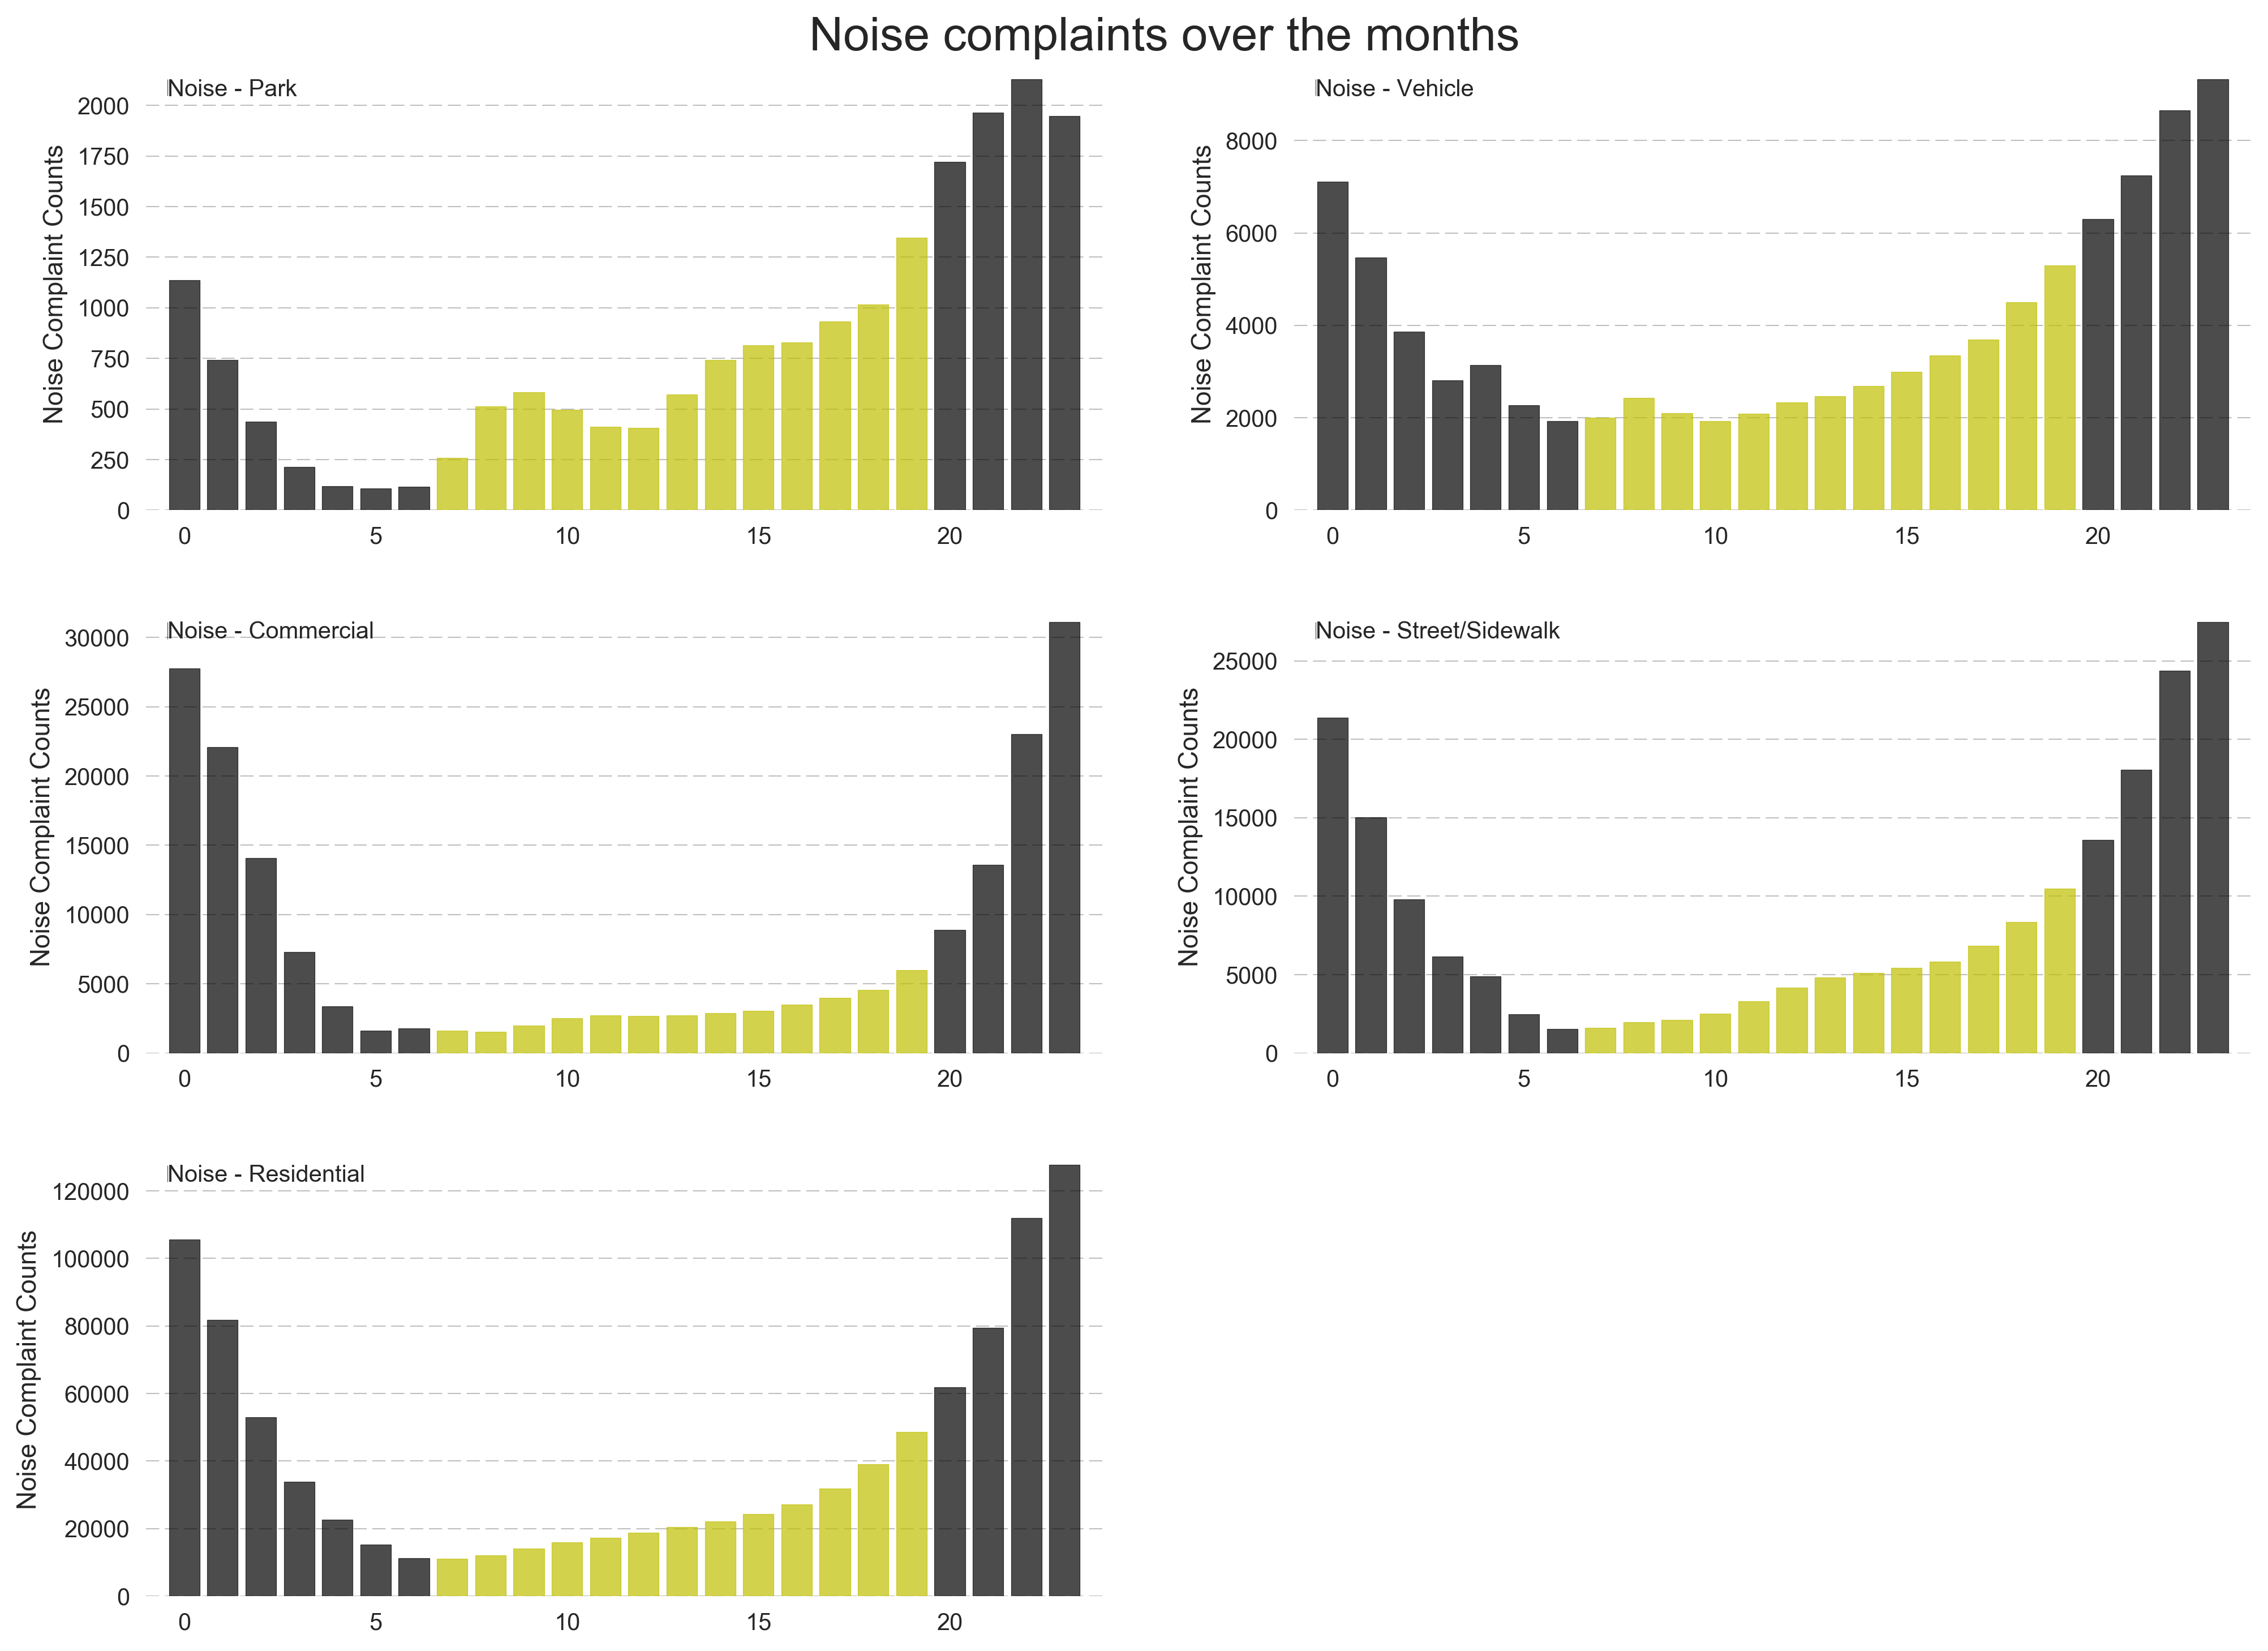
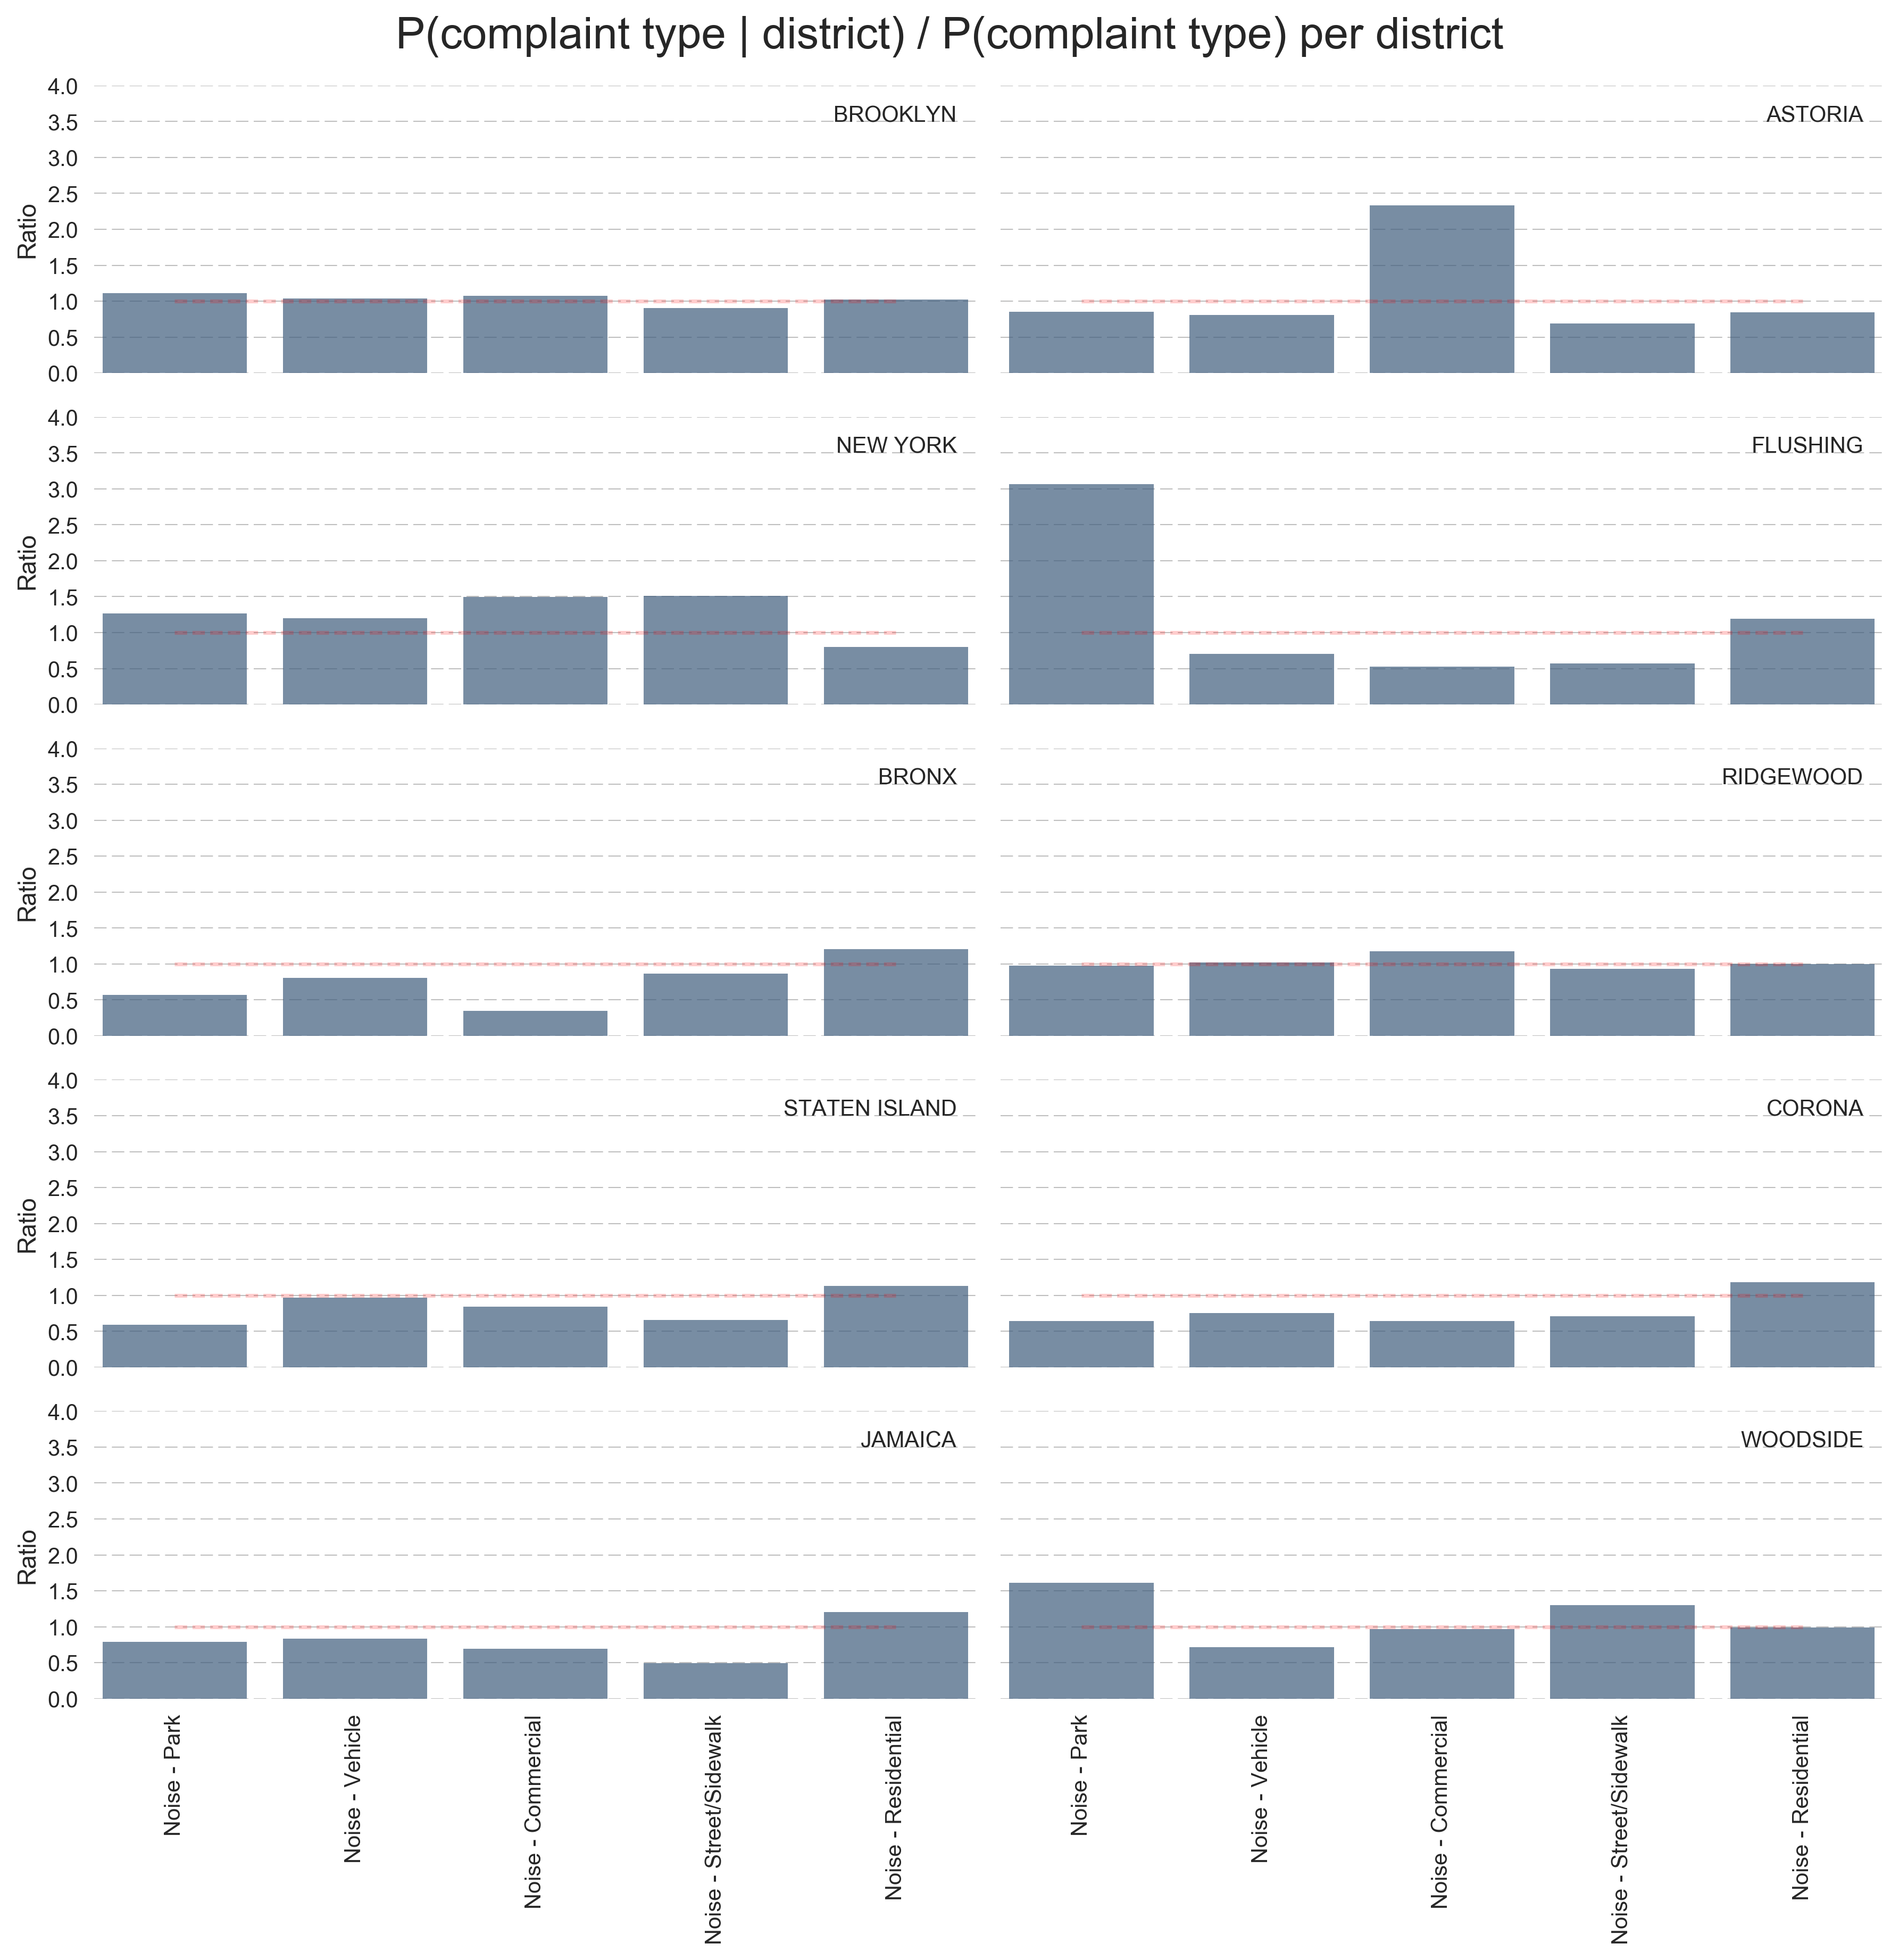
Did you know for example that the most frequent complaint is 'Noise - Residential'? What do these New Yorkers do in their apartments at night??

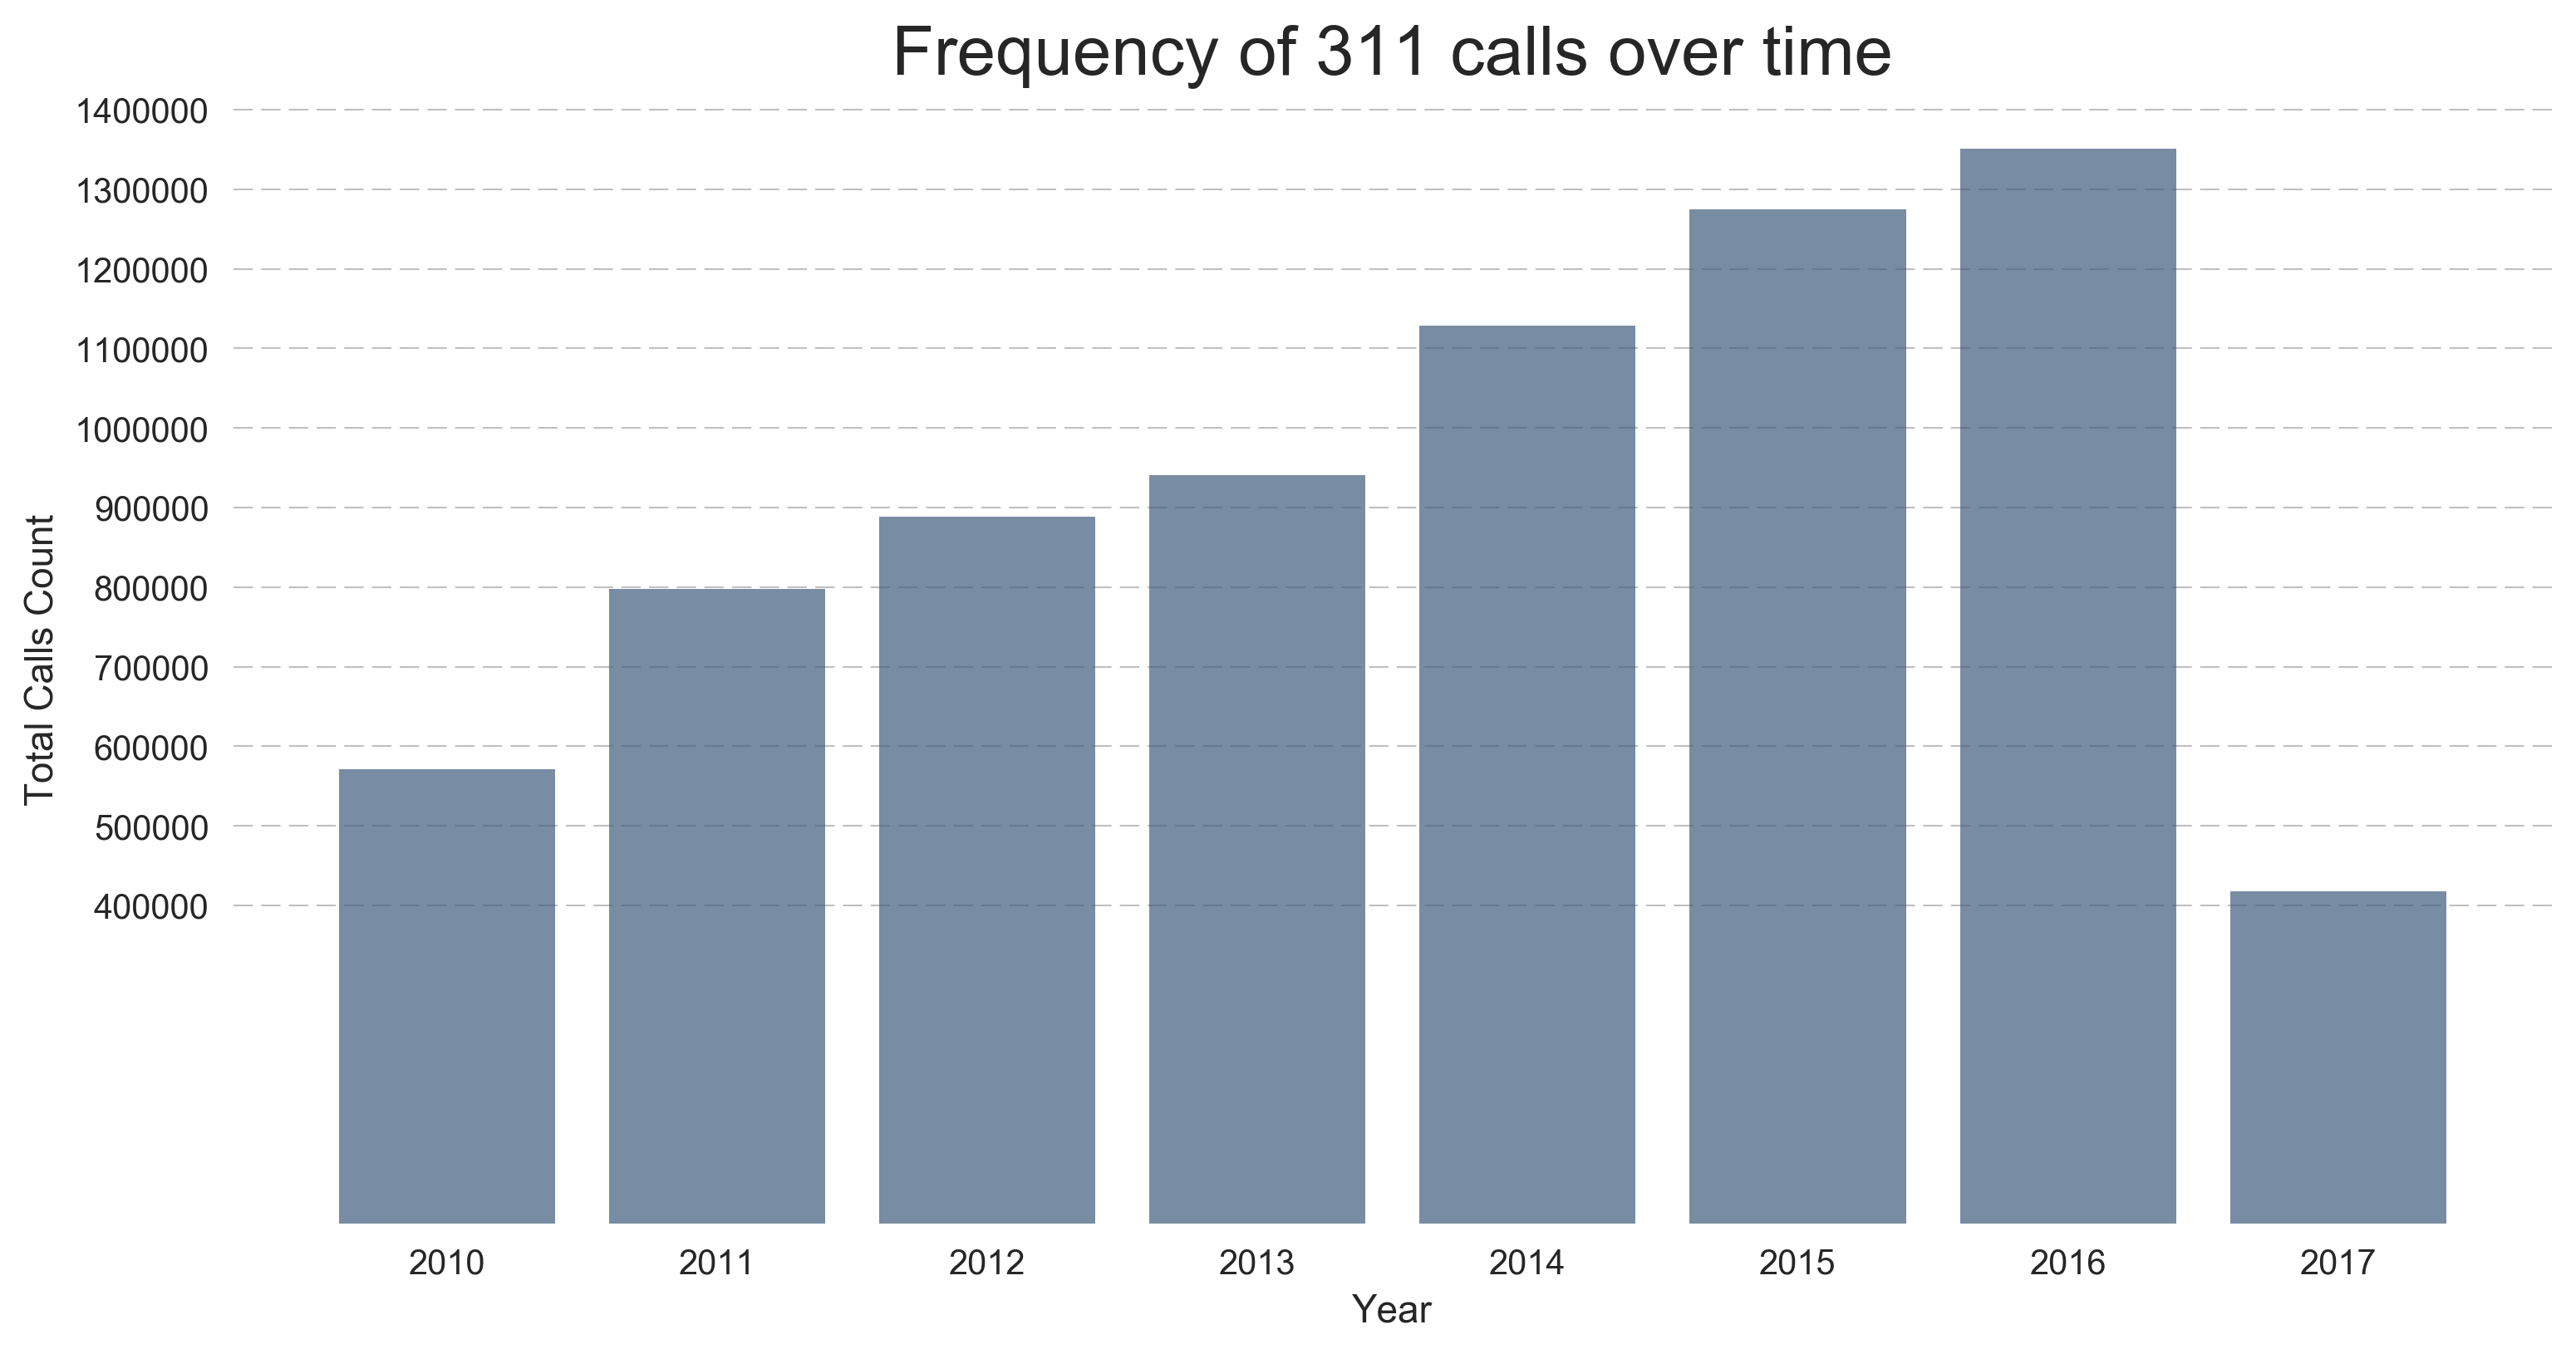
Do you have even a pale idea of how many complaints get submitted through this service? In 2016 alone there have been 1 351 096 requests! That is 3700 requests IN A DAY, or 5 requests per minute!

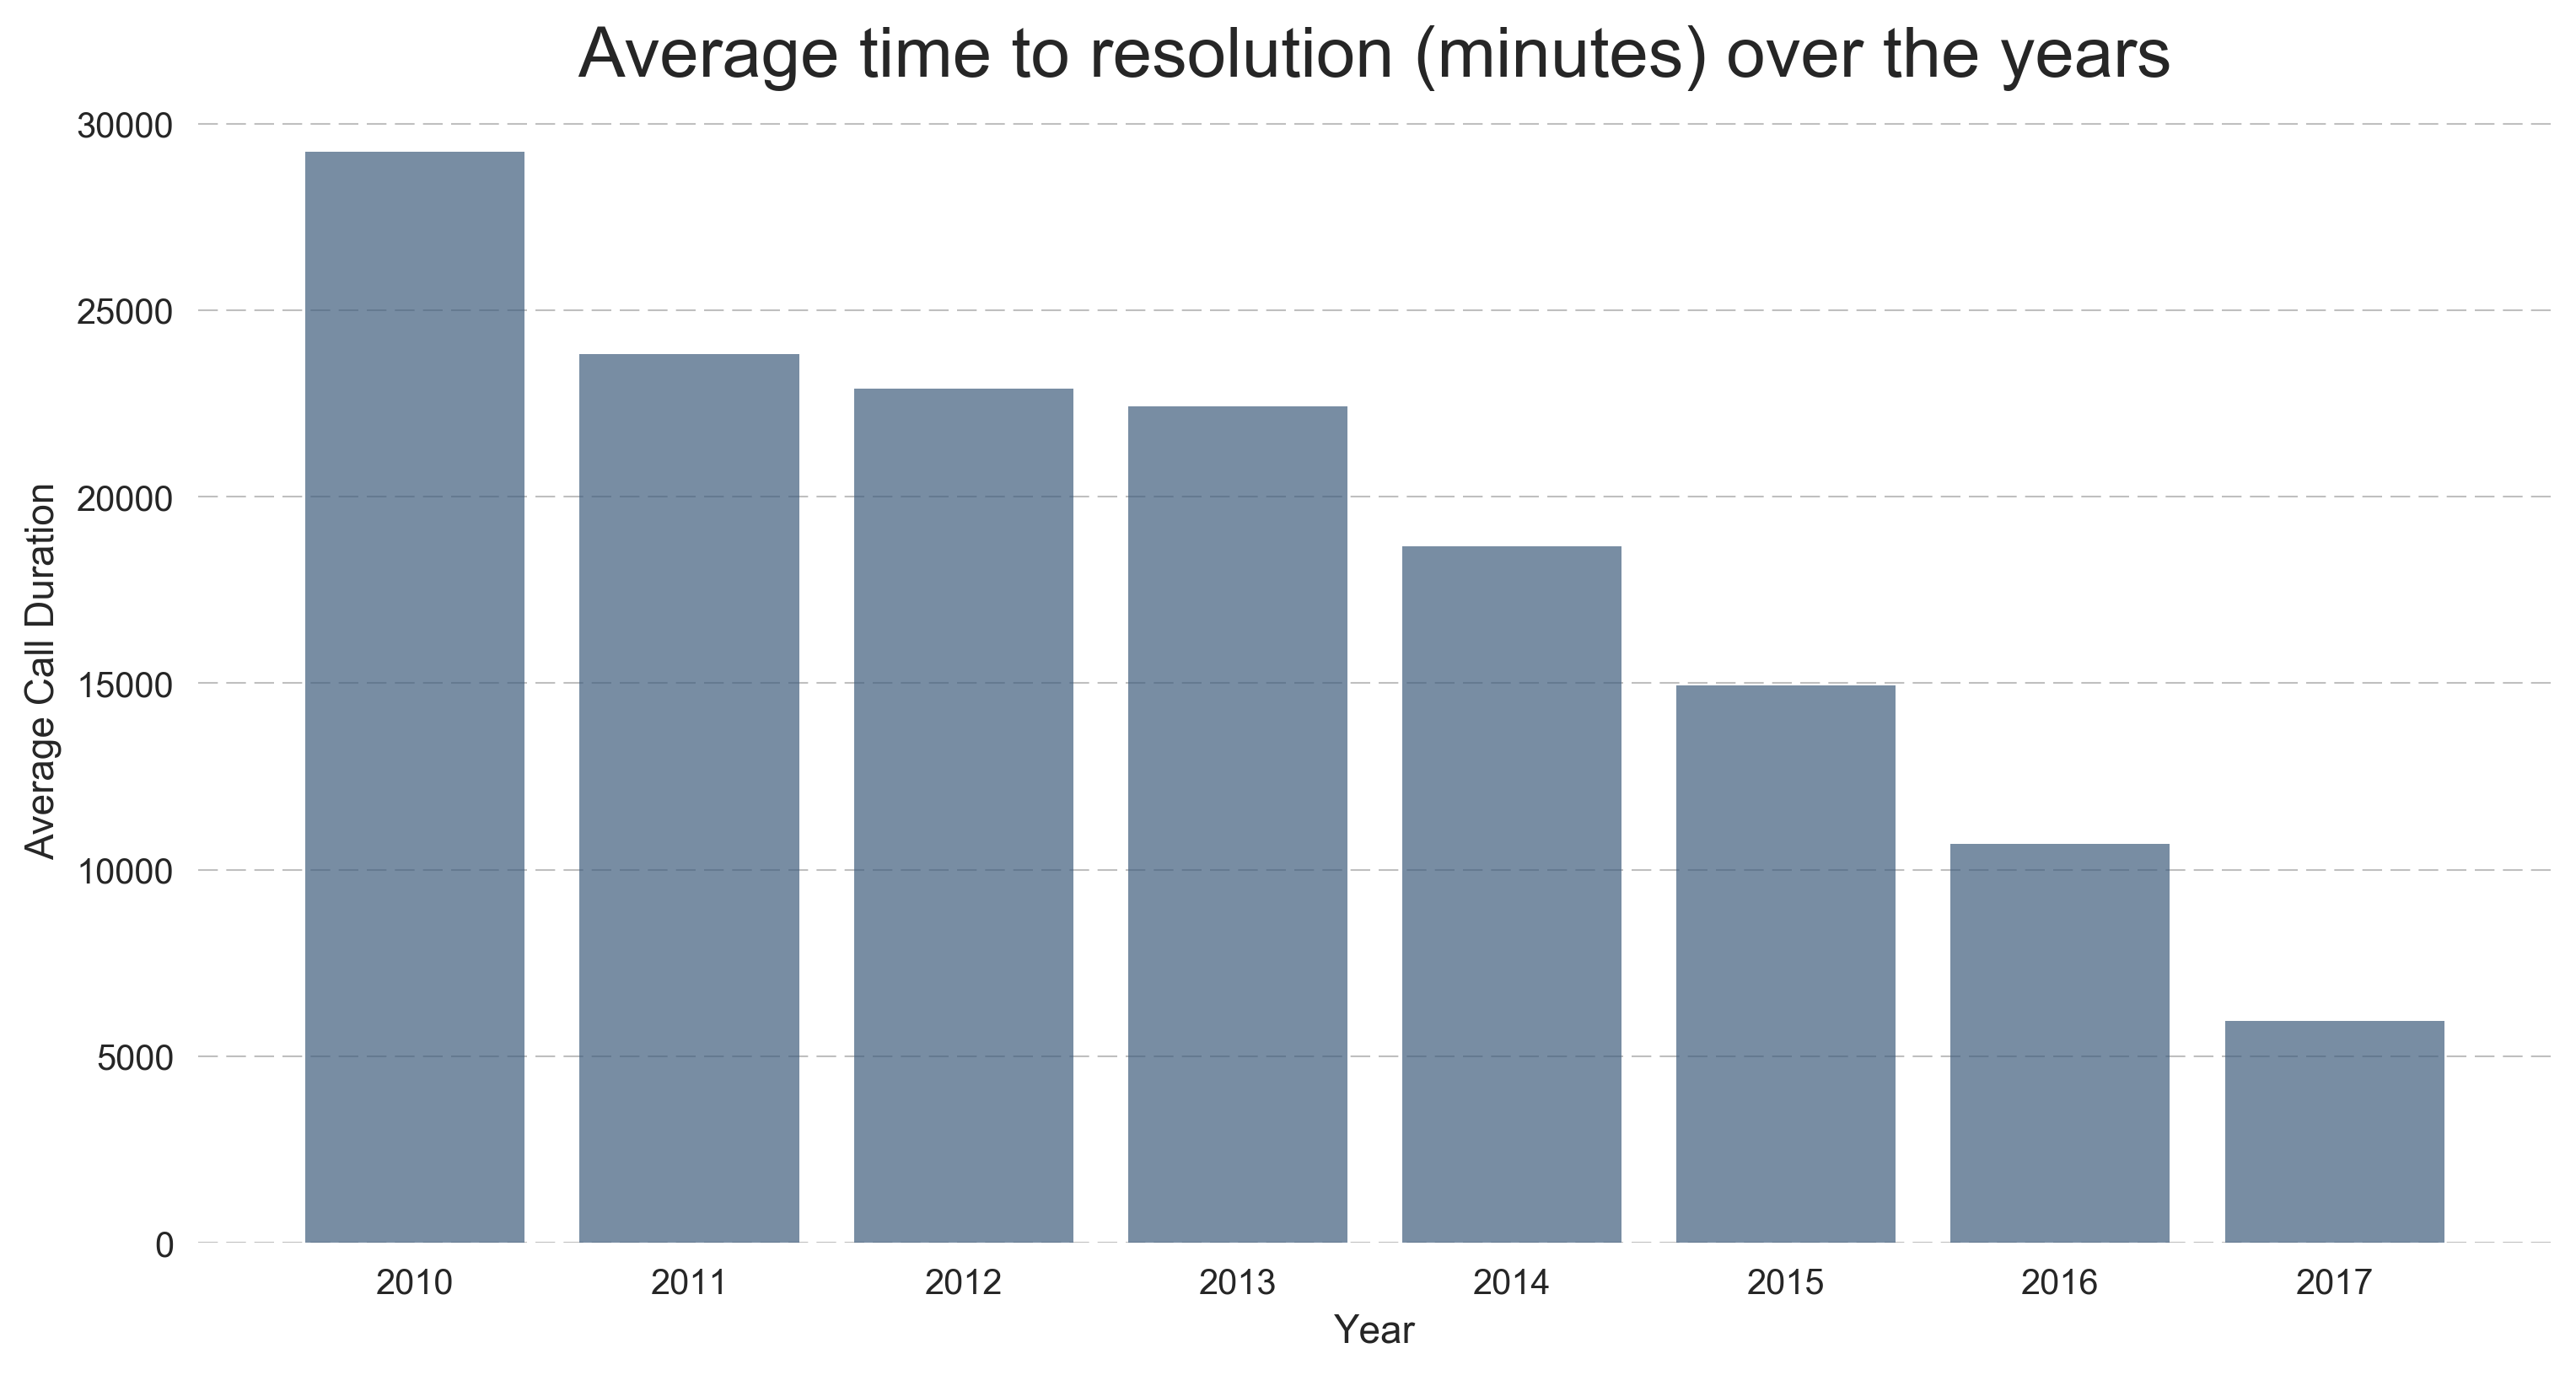
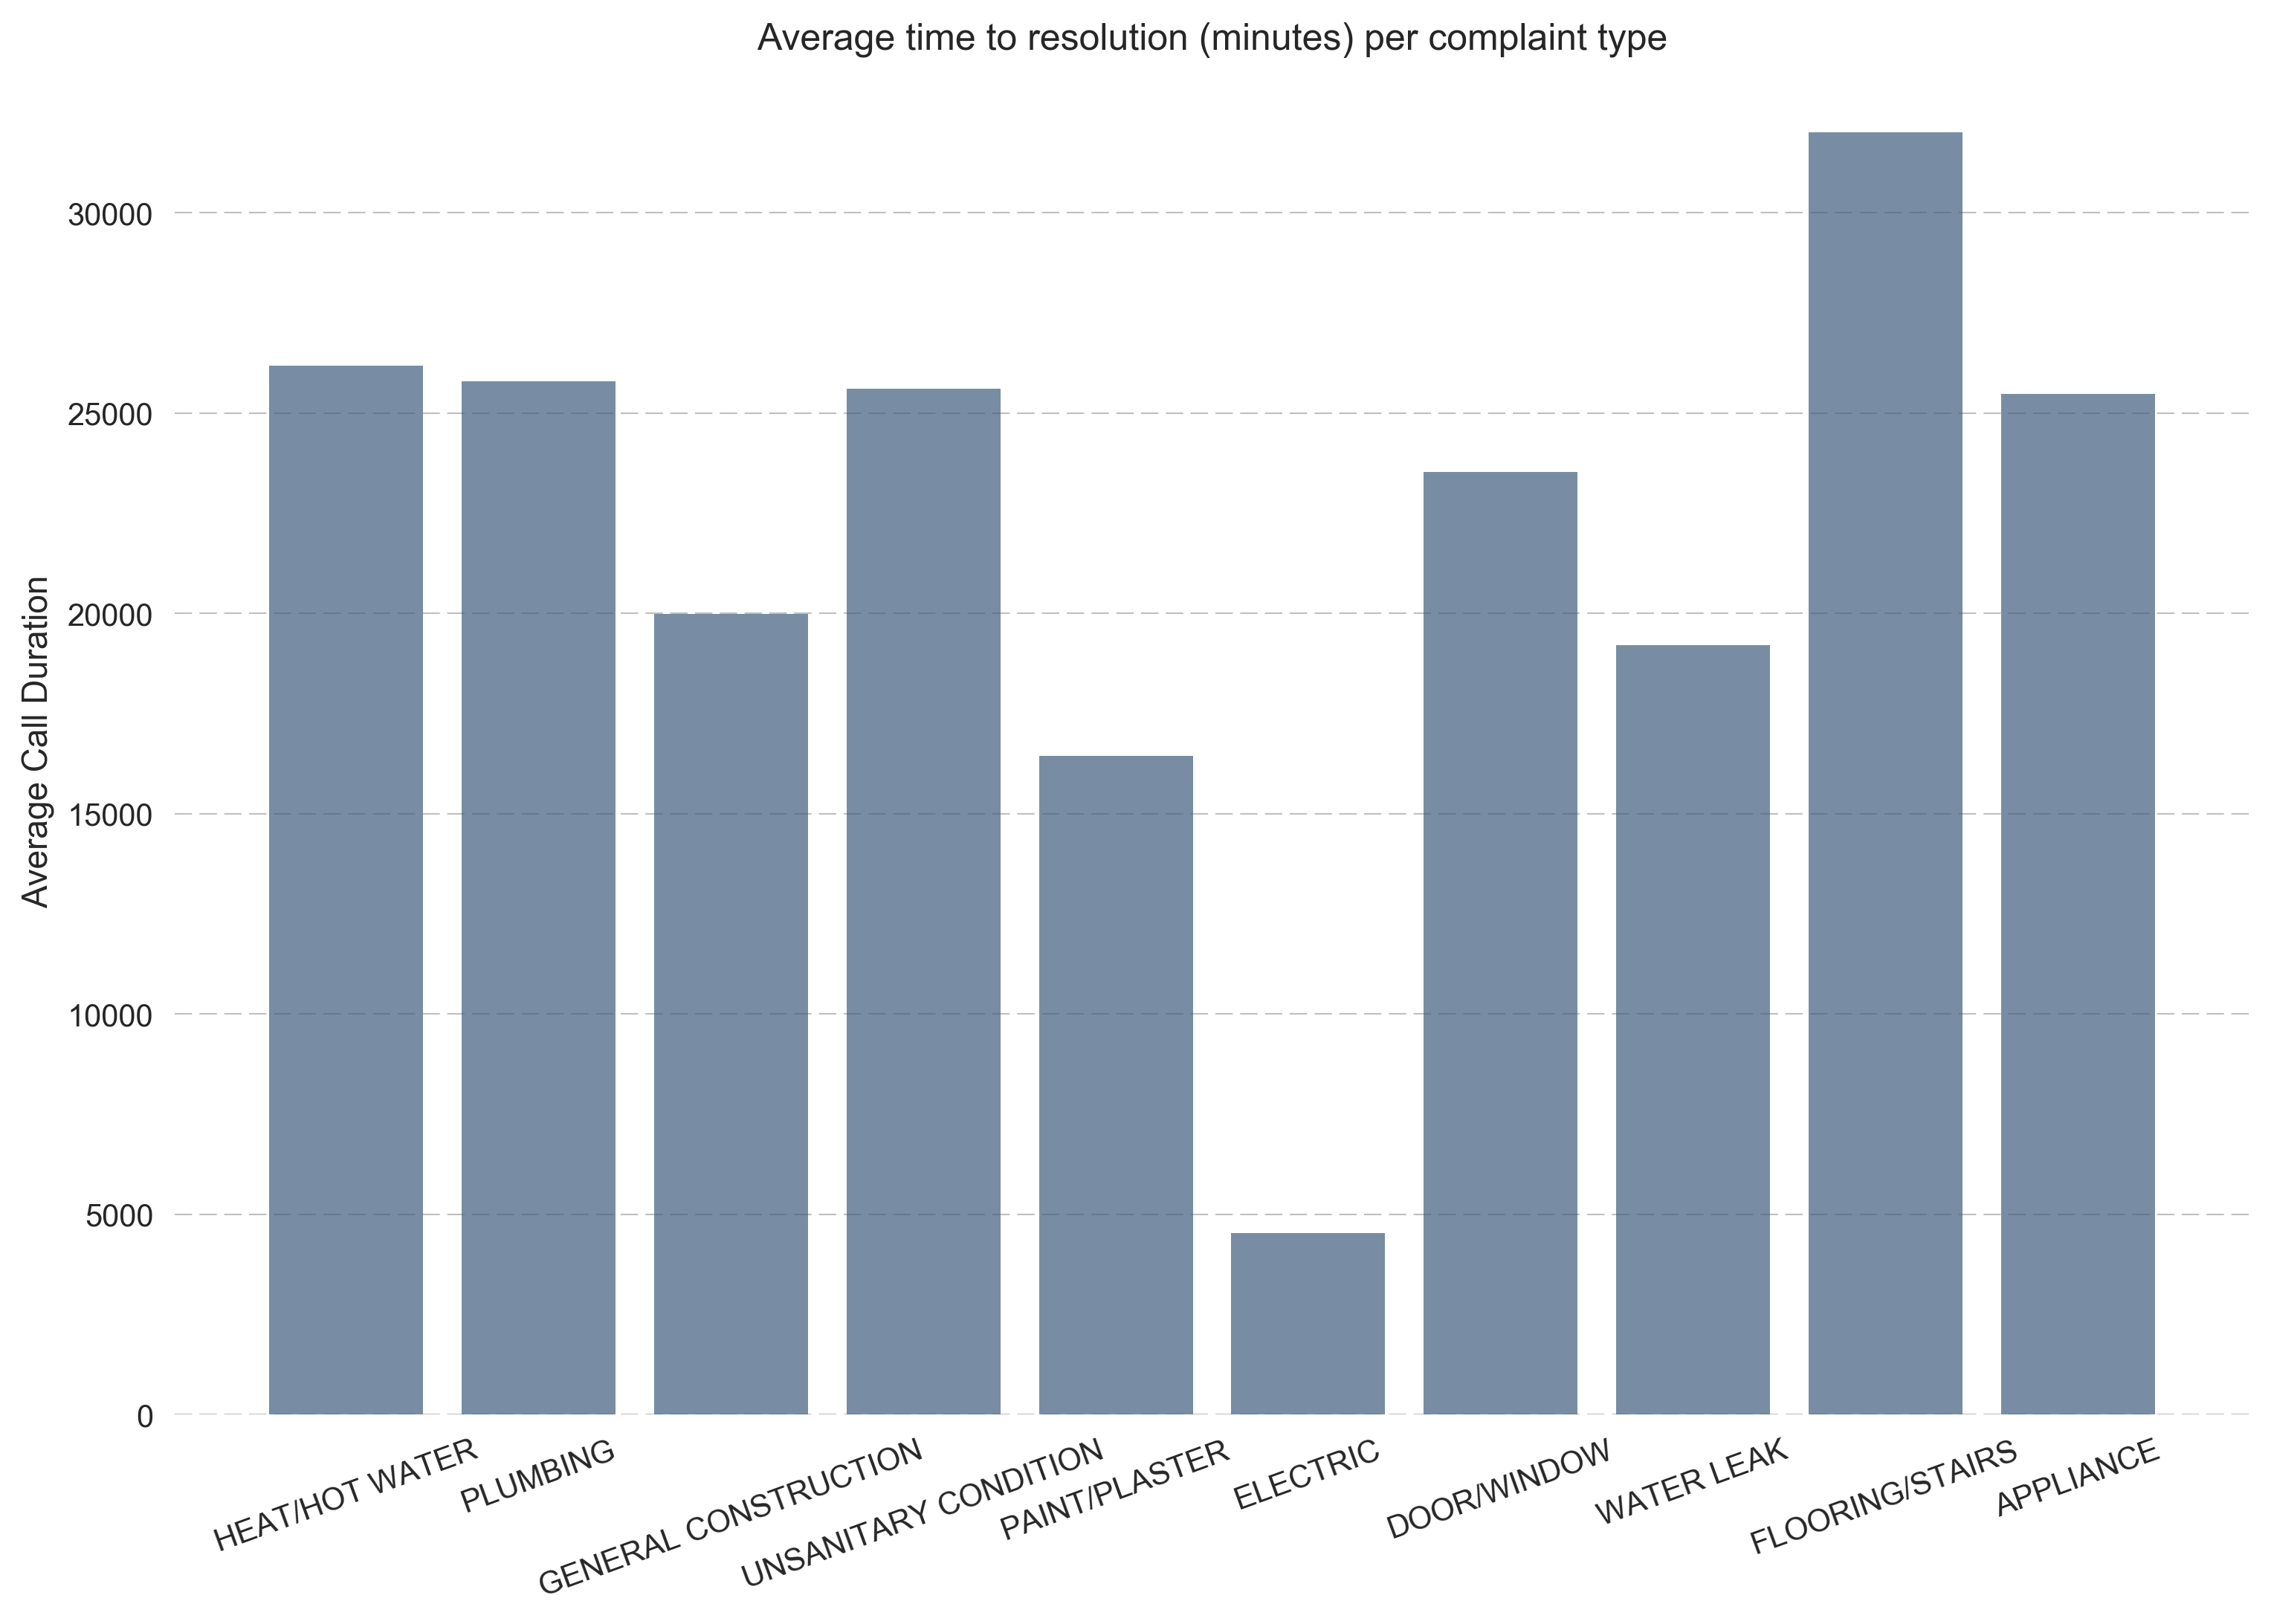
Do you want to know how the different New York agencies react to these requests? They are doing pretty well, last year the average time to resolution was around 5000 minutes, or 3 days. In comparison, in 2010 one request took in average 19 days to be resolved: quite an improvement!

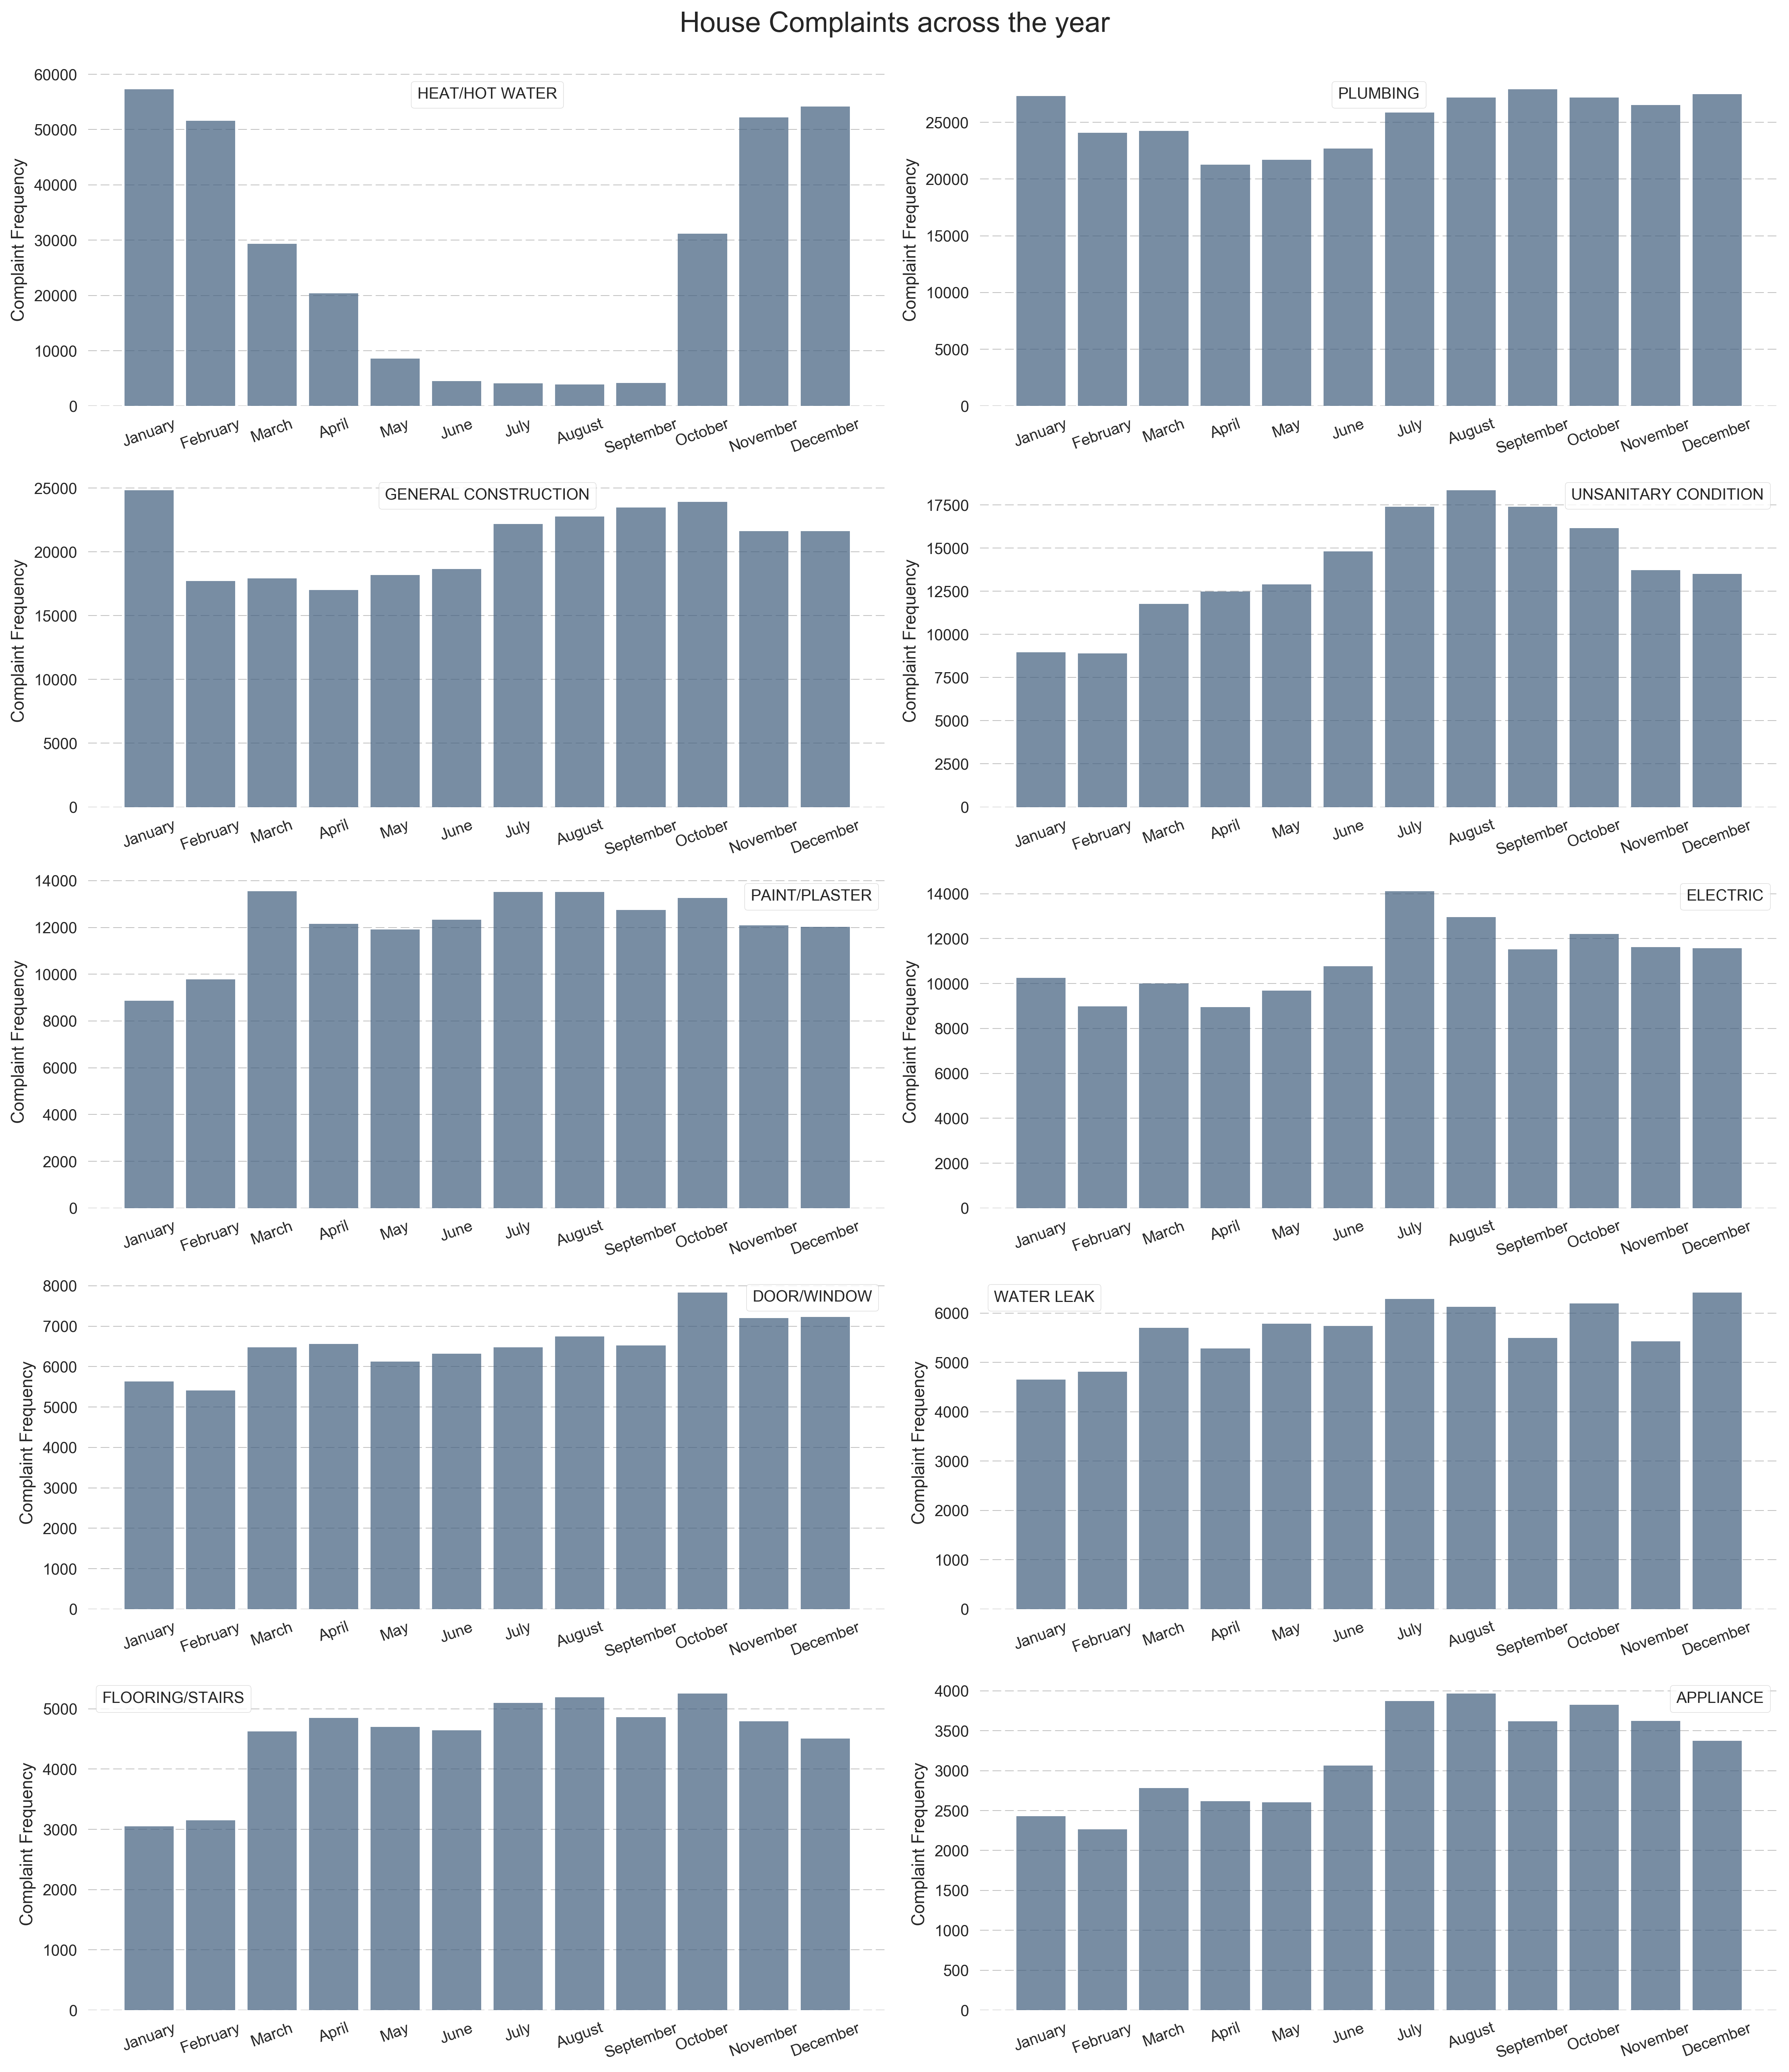
Below you can see some nice histograms that can tell you more about these stories.

House Complaints

There are no less than 559 unique categories of Service Request in the dataset. Among them, one set particulary intrigued us: House complaints. New Yorkers just love to call 311 to complain about missing Hot Water and needed Plumbing.

We analysed how these complaints are spread across the year. We found out that people tend to complaint a lot less about Heating in August than in December. Who would have said???

The below graphs are much more explanatory than words and luckily they have no sense of humour.

Prediction

Doing some Machine Learning black magic, we built the below visualization regarding House Complaints. It is capable of predicting what disgrace can happen in your house if you happen to live in one of the main neighboroods of New York, at any given time of the year.

Play around with it but don't consider us responsible for any water leak in your apartment.

What complaint should I expect if...

I live in... (district)

in... (month)

during the... (part of day)

Clustering

We dwelt in particular on one peculiar House Complaint: Unsanitary Conditions. In fact, we noticed that this type of 311 request is more frequently observed in certain areas of the city than others.

We leveraged another Machine Learning technique called K-Means clustering to show you this phenomenon. There is nothing we can explain better than the below visualization, so just press the fancy button below and play around.

Noise Complaints

The second part of our analysis verged on an equally fascinating subset of our data: Noise Complaints. Did you know that in 2016 there have been ~220000 'Noise - Residential' complaints? Let us do the math for you: that is 602 complaints per day, only in New York. Including weekdays!!!

We started again with a time analysis, distributing the complaints across the years and hours of the day. Our most important finding is that people tend to do a lot of noise in Parks at 10PM.

As usual, we leave you at the more eloquent diagrams below.

Prediction

We then focused on geographic locations, the most interesting part of the data.

As you may have understood by now, we are very fond of Machine Learning. We have trained a so-called K-Nearest Neighbour Classifier to predict the type of Noise Complaint, according to the geolocation of the data observation.

Sounds complicated? Without any more useless wording, try yourself what we mean in the below visualization. Just hover with your mouse on any point of the map and try to change the value of K (number of Nearest Neighbours) by clicking on the fancy buttons.

More

We would like to thank you for your attention until this point. We hope you enjoyed this brief dive into New York City and its funny complaints, we definitely did.

If you would like to learn more about our analysis, in more technical terms, you are invited to check out our Explainer Notebook. There you wil find a detailed description of all the cool Data Science technologies and Machine Learning techniques we used to obtain the results we have presented in this website.